
Fundamental Analysis for NGX Stocks: The Complete Investor’s Guide (Module 3)
By Market Formula Editorial Team / July 2026
Introduction
This is the most important module in the entire starter kit. Fundamental analysis for NGX stocks tells you what to buy, while technical analysis tells you when to buy. Get this right, and you will never again buy a stock simply because someone on WhatsApp said it was a good idea.
The Nigerian stock market has delivered extraordinary returns in 2026. The NGX All-Share Index advanced by 1.12% to close at 246,183.96 points as of July 20, 2026, with market capitalisation rising to N158.81 trillion. Year-to-date returns have exceeded 47%. Yet beneath this headline performance lies a critical truth: not all stocks are created equal, and the market’s momentum cannot protect you from buying a fundamentally weak company at the wrong price.
This module equips you with the tools to separate genuinely strong businesses from those that merely look attractive on the surface. You will learn where to find company financial reports, how to read the five key financial statements, the eight ratios that matter most for fundamental analysis for NGX stocks, and how to apply this framework in Nigeria’s unique economic environment.
If you haven’t already, start with Module 1 – NGX Basics and Module 2 – Investor Toolkit before diving into fundamental analysis.
Let’s build your fundamental analysis toolkit from the ground up.
1. Why Fundamentals Matter More on NGX – Fundamental Analysis for NGX Stocks
Before we get into numbers and ratios, you need to understand something important about the Nigerian stock market that changes how you should approach it.
The NGX is significantly less liquid than major international exchanges. This means fewer people are buying and selling at any given moment. In a less liquid market, prices can be pushed around more easily by a small group of large buyers or sellers. Stocks can look like they are rising when, in reality, a few institutional players are simply accumulating quietly. They can also look like they are collapsing when it is simply low volume and panic from uninformed retail investors.
This environment creates a very specific problem: technical analysis alone is not reliable enough on the NGX.
On forex markets, where trillions of dollars trade daily, price movements reflect the collective decisions of millions of participants — making chart patterns more meaningful. On the NGX, a stock with low daily trading volume can form a “textbook breakout” on a chart that means absolutely nothing because only a handful of people are involved in moving that price.
Fundamental analysis for NGX stocks protects you from this trap. When you know that a company is genuinely profitable, growing its revenue, carrying manageable debt, and paying consistent dividends — a temporary price dip becomes an opportunity rather than a reason to panic. You are not guessing based on a line on a chart. You are anchored in the reality of what the business is actually doing.
The investors who have quietly built real wealth on the NGX over the past two decades did not do it by trading charts. They did it by identifying strong businesses early, buying them at fair or undervalued prices, collecting dividends year after year, and holding patiently while others panicked in and out. Fundamental analysis for NGX stocks is the tool that makes that possible.
The market’s recent volatility underscores this lesson. The NGX Banking Index declined by 11.56% in June 2026 amid widespread profit-taking. Investors who understood the underlying fundamentals of their banking holdings were able to distinguish between a temporary sell-off and a genuine deterioration in business quality.
2. Where to Find NGX Company Financial Reports
Before you can analyze anything, you need the actual numbers. Here is exactly where to find them — all for free. This is the first step in any effective fundamental analysis for NGX stocks.
The NGX Website (ngxgroup.com)
The NGX publishes every financial result announced by listed companies. Navigate to the Investor Relations or Disclosures section. Every quarterly result, annual report, and corporate action is posted here as soon as it is released. The NGX Group itself reported a 157.3% surge in Profit Before Tax to N13.6 billion in 2024, demonstrating the kind of detailed financial data available through the exchange.
Company Investor Relations Pages
The company’s own website usually has a dedicated Investor Relations page where annual reports are available as downloadable PDFs. These are often more detailed than the exchange filings.
Financial News Platforms
Nairametrics and Proshare are Nigerian financial news platforms that publish analysis, summaries, and commentary on company results as they are released. They are excellent for context alongside the raw numbers.
The NGX Reporting Calendar
Nigerian companies are required to publish results on the following schedule:
| Period | Filing Window |
|---|---|
| First Quarter (Q1) | April to May |
| Half Year (H1) | July to August |
| Nine Months (9M) | October to November |
| Full Year / Annual | February to April of the following year |
The Annual Report is your most valuable document for fundamental analysis for NGX stocks. It contains the full financial statements, the auditor’s report, the board’s commentary, and the notes to the accounts — which is where the most revealing details are often buried.
3. The 5 Financial Statements You Need to Read
An NGX company’s annual report contains five main financial documents. Most beginners look at one — the income statement — and ignore the rest. That is a mistake. Each statement tells you a different part of the story, and together they give you a complete picture of the company’s financial health. This is the core of fundamental analysis for NGX stocks.
Statement 1 — The Income Statement (Profit & Loss Account or P&L)
This statement tells you whether the company made money over the year. It shows three things that matter most to you as an investor.
Revenue (Turnover): The total money the company earned from its business activities before any costs are deducted. A company whose revenue is growing year after year is a healthy sign — it means the business is expanding.
Gross Profit: What is left after deducting the direct costs of producing goods or delivering services. It tells you how efficiently the company converts sales into profit at the core business level.
Profit After Tax (PAT): The bottom line — what is left for shareholders after every cost, expense, interest payment, and tax has been deducted. This is the number that drives dividends and earnings per share (EPS).
What to watch for: Revenue growing but PAT shrinking is a warning sign. It means costs are rising faster than sales — a squeeze that becomes dangerous over time.
Statement 2 — The Balance Sheet (Statement of Financial Position)
While the income statement shows what happened over the year, the balance sheet shows where the company stands on a single day — the last day of the financial year. Think of it as a snapshot of the company’s financial strength at a specific moment.
Assets: Everything the company owns — cash, properties, equipment, inventory, money owed to it by customers. Assets are divided into current assets (convertible to cash within 12 months) and non-current assets (long-term holdings like land and machinery).
Liabilities: Everything the company owes — bank loans, money owed to suppliers, tax obligations. Like assets, they are split into current liabilities (due within 12 months) and non-current liabilities (long-term debt).
Shareholders’ Equity: The difference between total assets and total liabilities. It represents what belongs to you and every other shareholder after all debts are settled. Growing equity over time is a sign of a company genuinely building value.
The fundamental rule of the balance sheet: Assets always equal liabilities plus equity. If they do not balance in a company’s report, something is wrong.
What to watch for: A company whose liabilities are growing faster than its assets is taking on more risk than it is building value. This is especially dangerous in a high-interest-rate environment like Nigeria’s, where debt becomes increasingly expensive to service.
Statement 3 — The Cash Flow Statement
This is the most underappreciated statement — and the one that experienced investors read first.
The cash flow statement tells you how much actual cash moved in and out of the business during the year. It is divided into three sections: cash from operating activities, cash from investing activities, and cash from financing activities.
Here is why this statement is so important: a company can show a profit on its income statement and still be running out of cash.
This happens because accounting rules allow companies to record revenue when a sale is made — even if the customer has not yet paid. A company can be “profitable on paper” while its actual cash is being drained by customers who are slow to pay, by heavy inventory build-up, or by aggressive expansion that has not yet generated returns.
The cash flow statement strips away all accounting adjustments and shows you the raw reality: how much cash did this business actually generate from its operations?
What to watch for: Consistently positive cash flow from operations is one of the strongest signs of a genuinely healthy business. A company that repeatedly shows profit but negative operating cash flow deserves serious scrutiny before you invest a single naira.
Statement 4 — Statement of Changes in Equity
This statement tracks how the shareholders’ equity portion of the balance sheet moved over the year. It shows you retained earnings (profits kept in the business), dividends paid out, and any new shares issued.
For a dividend-focused investor, this statement confirms the actual dividend payment made during the year and shows you whether the company is retaining enough profit to fund future growth.
What to watch for: A company paying out more in dividends than it earned in profit is either eating into its reserves or borrowing to pay shareholders. Both are unsustainable over time.
Statement 5 — Notes to the Financial Accounts
Most beginners never read the notes. This is one of the biggest mistakes you can make.
The notes to the accounts are the detailed explanations behind every line in the financial statements. They tell you the breakdown of loans and their interest rates, the details of related-party transactions (business dealings between the company and its directors or connected parties), contingent liabilities (potential future obligations that are not yet on the balance sheet), and the accounting policies the company used to present its numbers.
This is where auditors flag concerns. This is where management quietly discloses risks they are legally required to mention but prefer you not notice. This is where the real story often lives.
What to watch for: Any note that references legal proceedings against the company, significant related-party transactions that benefit directors personally, or changes in accounting policies that happen to make the numbers look better than they were before.
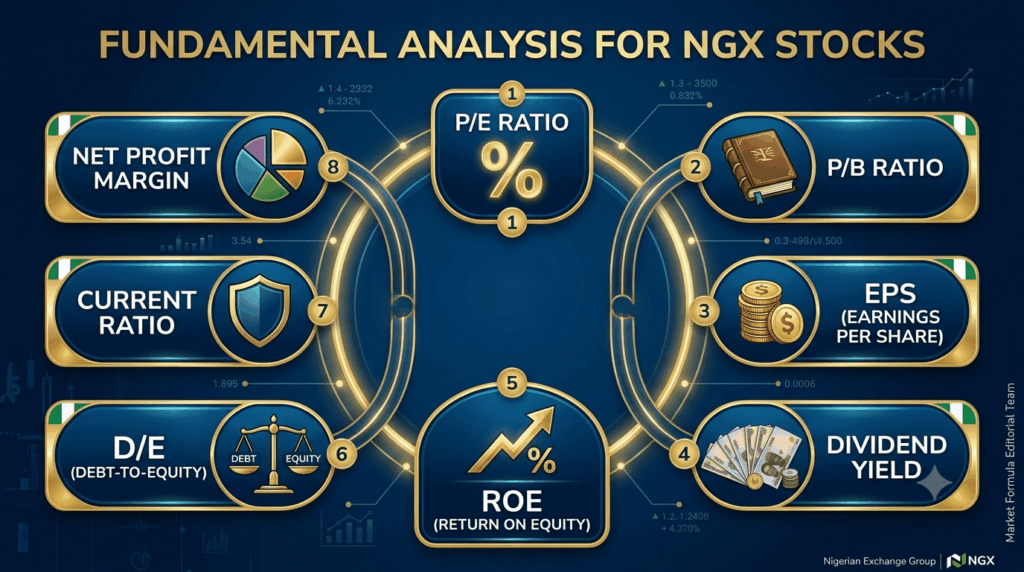
4. The 8 Key Ratios for Fundamental Analysis for NGX Stocks
Raw financial statement numbers are useful — but ratios are how you make them comparable across companies. A company with ₦50 billion in profit sounds impressive until you realize it took ₦2 trillion in assets to generate that. Ratios put numbers in context.
Here are the 8 ratios that matter most for fundamental analysis for NGX stocks. Your Excel Screener automatically calculates all of these once you input the raw data.
Ratio 1 — Price-to-Earnings Ratio (P/E)
Formula: Share Price ÷ Earnings Per Share (EPS)
The P/E ratio tells you how much the market is willing to pay for every naira of profit the company earns. A P/E of 10 means investors are paying ₦10 for every ₦1 of annual earnings.
A lower P/E generally suggests a cheaper stock — you are paying less for each naira of profit. A higher P/E suggests either an expensive stock or one where investors expect strong future growth.
NGX practical context: The NGX currently trades on an attractive P/E ratio of 6.92x, well below the 10-year average of 11.3x and significantly lower than regional stock markets like South Africa (16.2x) and the frontier markets index (11.5x). This means Nigerian stocks are relatively cheap compared to their historical and regional benchmarks.
However, the critical thing to understand about P/E on the NGX: always compare within the same sector. A P/E of 8 might be cheap for a consumer goods company but expensive for a bank. Comparing a bank’s P/E to a cement company’s P/E is meaningless. Sector context is everything.
Ratio 2 — Price-to-Book Ratio (P/B)
Formula: Share Price ÷ Book Value Per Share
Book value per share is essentially what each share would theoretically be worth if the company sold all its assets and paid off all its debts today. The P/B ratio compares the market price to this underlying asset value.
A P/B below 1.0 means the market is valuing the company at less than the worth of its assets on paper. This can signal an undervalued stock — or it can signal that investors do not trust the stated value of those assets. Context and additional analysis matters here.
Ratio 3 — Earnings Per Share (EPS)
Formula: Profit After Tax ÷ Total Number of Shares
EPS tells you how much profit the company generated for each share in existence. It is the building block for dividends — a company can only sustainably pay dividends from its earnings.
What matters most with EPS is not the absolute number but the trend over time. A company growing its EPS consistently — say, from ₦2.50 to ₦3.10 to ₦3.80 over three years — is a company whose earning power is compounding. That trend is one of the strongest signals of a genuinely good business.
Ratio 4 — Dividend Yield
Formula: Dividend Per Share ÷ Share Price × 100
This ratio tells you the cash income return you receive from holding the stock — expressed as a percentage of the current price. If a stock is trading at ₦20 and the company paid a ₦1.50 dividend last year, the dividend yield is 7.5%.
For many Nigerian investors, particularly those seeking income rather than speculation, dividend yield is the primary lens through which they evaluate stocks. A consistent dividend yield of 6–12% from a fundamentally strong company is genuinely attractive — especially when you factor in the potential for price appreciation on top.
NGX practical context: In 2026, some of the highest-yielding NGX stocks include MTN Nigeria with a N15 per share dividend. The NGX Group itself paid an annual dividend of 2.25 NGN per share with a yield of 1.96%. However, an unusually high dividend yield — say, above 20% — is not automatically a good thing. It may signal that the share price has fallen sharply due to a serious problem with the business.
Ratio 5 — Return on Equity (ROE)
Formula: Profit After Tax ÷ Shareholders’ Equity × 100
ROE measures how efficiently management is using the money shareholders have invested in the business to generate profit. It answers a simple question: for every ₦100 shareholders have put into this company, how many naira of profit does management produce?
An ROE of 20% means management generates ₦20 of profit for every ₦100 of shareholder money. That is a strong result. An ROE of 5% means management is generating only ₦5 — poor capital efficiency.
ROE is one of the best indicators of management quality. Great management teams consistently generate high ROE over many years. Mediocre management teams produce low or erratic ROE regardless of how favorable the business environment is.
NGX benchmark: An ROE above 15% is generally considered good. The best Nigerian banks have historically delivered ROE between 20% and 35%.
Ratio 6 — Debt-to-Equity Ratio (D/E)
Formula: Total Debt ÷ Total Shareholders’ Equity
This ratio tells you how much debt the company is carrying relative to what shareholders own. A D/E of 0.5 means the company has ₦0.50 of debt for every ₦1 of equity — relatively conservative. A D/E of 2.0 means the company has ₦2 of debt for every ₦1 of equity — significantly leveraged.
In Nigeria’s high-interest-rate environment, debt is expensive. Companies carrying heavy debt loads spend a large portion of their profit servicing interest — money that could otherwise go to shareholders as dividends or be reinvested in growth. High debt also makes companies vulnerable during economic downturns when revenue may drop but interest payments do not.
Ratio 7 — Current Ratio
Formula: Current Assets ÷ Current Liabilities
The current ratio measures a company’s ability to pay its short-term obligations using its short-term assets. In plain terms: if every bill due within the next 12 months came in tomorrow, could the company pay them?
A current ratio above 1.5 is generally healthy — the company has ₦1.50 in accessible assets for every ₦1 it owes in the short term. A current ratio below 1.0 is a warning flag — the company may struggle to meet near-term obligations without taking on new debt or selling assets.
Ratio 8 — Net Profit Margin
Formula: Profit After Tax ÷ Revenue × 100
Net profit margin tells you how much of every naira earned in revenue actually becomes profit after all costs are paid. A net profit margin of 15% means the company keeps ₦15 of every ₦100 it earns. The remaining ₦85 went to costs, taxes, and expenses.
Higher margins are better — they indicate pricing power, cost discipline, and operational efficiency. But like P/E ratios, margins must be compared within sectors. A 5% margin is outstanding for a supermarket chain operating on thin margins by nature. The same 5% margin for a pharmaceutical company with high-value products would be concerning.
5. Reading an NGX Annual Report – Fundamental Analysis for NGX Stocks
Now that you understand the statements and the ratios, here is how to approach an actual annual report when you sit down to analyze a company. Follow these steps in this order.
Step 1 — Read the Chairman’s Statement first
Before touching a single number, read what the Chairman and Managing Director wrote to shareholders. This section tells you how management perceives the business, what challenges they faced, what their strategy is, and where they see the company heading. Read it critically. Is management being honest about difficulties, or only celebrating wins? Do their stated priorities align with what the numbers show?
Step 2 — Check the auditor’s report
Look for the key phrase: “in our opinion, the financial statements give a true and fair view.” This is the clean bill of health. If the auditor has added qualifications, exceptions, or emphasis-of-matter paragraphs, read every word carefully. Auditor qualifications are serious red flags that the market often underreacts to.
Step 3 — Look at 5-year financial highlights
Most Nigerian annual reports include a five-year summary of key metrics — revenue, PAT, EPS, dividends, and total assets. This single page is one of the most valuable in the entire report. It shows you immediately whether the company is on a growth trajectory or a declining one. Trends are always more telling than a single year’s numbers.
Step 4 — Calculate your 8 ratios
Using the numbers from the income statement and balance sheet, work through all eight ratios.
Step 5 — Read the notes to the accounts
Pay particular attention to the notes on borrowings (what debt is outstanding, at what interest rates, and when it matures), related-party transactions (are directors awarding contracts to their own companies?), and contingent liabilities (are there pending lawsuits that could become significant financial obligations?).
Step 6 — Form your overall view
After all of this, ask yourself three questions: Is this a genuinely profitable and growing business? Is management trustworthy and competent? Is the current share price fair, cheap, or expensive relative to what the business is worth? Your answers guide your decision.
6. How Naira Devaluation Affects Different NGX Sectors
This is Nigeria-specific knowledge that no overseas stock market course will teach you — and it is arguably the most practical edge you can develop as a local investor. Any comprehensive fundamental analysis for NGX stocks must account for currency dynamics.
The naira’s exchange rate is not just a macroeconomic statistic. It is a direct input into the profitability of almost every company listed on the NGX. Understanding which companies benefit and which suffer when the naira moves gives you a powerful framework for sector rotation — shifting your investments toward the sectors best positioned for the current economic moment.
Companies That Benefit from Naira Weakness
These are businesses that earn revenue in dollars or hard currency while their costs are largely in naira. When the naira falls, their naira-equivalent revenues increase dramatically even if their underlying business activity stays the same.
- Oil and gas companies with dollar-denominated oil sales
- Telecom companies like MTNN and Airtel Africa, which report in dollars and convert to naira
- Agricultural exporters such as Presco and Okomu Oil, which earn foreign exchange from palm oil exports
Companies That Suffer from Naira Weakness
These are businesses that import raw materials, machinery, or finished goods in dollars but sell their products in naira to Nigerian consumers. When the naira falls, their cost of production rises sharply but they face resistance raising prices in an already stretched consumer market.
- Consumer goods companies — Nestlé, Unilever, Nigerian Breweries — have historically been squeezed by naira devaluation because their raw material costs are largely dollar-linked
- Industrial manufacturers who import equipment and inputs face the same pressure
Banks — A More Complex Picture
Nigerian banks are neither simple beneficiaries nor simple victims of naira devaluation. They hold foreign currency assets and liabilities simultaneously. When the naira weakens, their dollar assets translate into more naira — boosting their balance sheets. But if their customers borrowed in dollars and earn in naira, loan defaults rise. The net effect depends on how each bank manages its foreign currency exposure.
The practical takeaway: When the naira is under pressure or in a devaluation cycle, tilt your portfolio toward dollar-earning companies — energy, telecom, agricultural exporters. When the naira is stabilizing or recovering, consumer goods and manufacturing companies with suppressed margins may represent compelling recovery plays.
7. Action Plan: Applying the Fundamental Analysis Framework
Now that you understand the fundamental analysis for NGX stocks framework, here is your practical action plan.
Step 1: Build your watchlist.
Start with 10–15 companies from the NGX 30. Focus on sectors you understand.
Step 2: Gather annual reports.
Download the last 3–5 years of annual reports from the NGX website or company IR pages.
Step 3: Calculate the 8 key ratios.
Work through P/E, P/B, EPS, Dividend Yield, ROE, D/E, Current Ratio, and Net Profit Margin for each company.
Step 4: Compare within sectors.
A bank with a P/E of 4x may be cheap, but only if its peers trade at 6x. Compare apples to apples.
Step 5: Read the notes.
Pay attention to debt maturities, related-party transactions, and contingent liabilities.
Step 6: Factor in the naira.
Is the company a dollar-earner or a dollar-spender? Position accordingly.
Step 7: Make your decision.
Only buy when the fundamentals are strong AND the price is fair or undervalued.
8. Module 3 — Quick Summary
| Concept | What You Now Know |
|---|---|
| Why fundamentals first | Low NGX liquidity makes charts unreliable — fundamentals anchor your decisions |
| Where to find reports | NGX website, company IR pages, Nairametrics, Proshare — all free |
| 5 financial statements | Income statement, balance sheet, cash flow, equity changes, notes |
| Cash flow matters most | Profit on paper ≠ cash in hand — always check operating cash flow |
| 8 key ratios | P/E, P/B, EPS, Dividend Yield, ROE, D/E, Current Ratio, Net Profit Margin |
| NGX P/E context | Current NGX P/E is 6.92x — below 10-year average of 11.3x |
| Annual report process | 6-step walkthrough from Chairman’s statement to forming your investment view |
| Naira & sectors | Dollar-earners benefit from devaluation — importers suffer. Know which is which |
9. Final Summary & The Bottom Line
Fundamental analysis is the foundation of intelligent investing on the NGX. In a market where liquidity can be thin and prices can be distorted by a small number of large players, knowing the true value of a business protects you from making decisions based on noise rather than reality.
  ┌──────────────────────────────────────────────────────────┐
  │     FUNDAMENTAL ANALYSIS FRAMEWORK – KEY TAKEAWAYS        │
  ├─────────────────────┬────────────────────────────────────┤
  │ Why Fundamentals    │ NGX liquidity is low — charts      │
  │ Matter Most         │ alone are unreliable               │
  ├─────────────────────┼────────────────────────────────────┤
  │ 5 Statements        │ Income, Balance Sheet, Cash Flow,  │
  │                     │ Equity Changes, Notes              │
  ├─────────────────────┼────────────────────────────────────┤
  │ 8 Key Ratios        │ P/E, P/B, EPS, Dividend Yield,     │
  │                     │ ROE, D/E, Current Ratio, NPM       │
  ├─────────────────────┼────────────────────────────────────┤
  │ NGX P/E (2026)      │ 6.92x — below 10-year average      │
  │                     │ of 11.3x[reference:18]              │
  ├─────────────────────┼────────────────────────────────────┤
  │ Annual Report       │ 6-step process: Chairman → Auditor │
  │ Walkthrough         │ → 5-year highlights → Ratios →    │
  │                     │ Notes → Overall view               │
  ├─────────────────────┼────────────────────────────────────┤
  │ Naira & Sectors     │ Dollar-earners (energy, telecom)   │
  │                     │ benefit from devaluation;          │
  │                     │ importers (consumer goods) suffer  │
  └─────────────────────┴────────────────────────────────────┘
The Bottom Line:
The NGX currently trades at an attractive P/E ratio of 6.92x, significantly below its 10-year average and well below regional peers. This means there are genuinely undervalued opportunities available for investors who know how to find them.
The most successful NGX investors are not those who trade frequently or chase the hottest tips. They are those who understand the businesses they own, buy at fair or undervalued prices, collect dividends year after year, and hold patiently while others panic in and out. Fundamental analysis is the tool that makes that possible.
For more weekly NGX updates and strategy guides, explore our market trends and analysis archive.
Coming up in Module 4: Technical Analysis for NGX Stocks — how to use your existing chart-reading skills from forex to time your entries on fundamentally strong companies, which tools actually work on the NGX, and the powerful hybrid approach that combines both disciplines into one complete investment process.
Disclaimer: This article is for informational purposes only and does not constitute investment advice. Always conduct your own research or consult a qualified financial advisor before investing. Past performance does not guarantee future results.