
Technical Analysis for NGX Stocks: The Complete Investor’s Guide (Module 4)
By Market Formula Editorial Team / July 2026
Introduction
You already understand charts from forex trading. This module shows you exactly how to apply that knowledge to NGX stocks — what works, what does not, and how combining both disciplines gives you an edge most Nigerian investors simply do not have.
The Nigerian stock market has delivered extraordinary returns in 2026. The NGX All-Share Index closed at 246,183.96 points on July 20, 2026, with market capitalisation at N158.81 trillion and year-to-date returns exceeding 58.20%. The market has become the strongest frontier equity market in 2026, with investors gaining nearly N56 trillion year-to-date.
Yet beneath this stellar performance lies a critical challenge: the NGX is significantly less liquid than major international exchanges——Beyond the top 30 stocks (the NGX-30), liquidity is a “ghost”. This creates a unique environment where technical analysis for NGX stocks must be applied selectively and with fundamental anchors.
This module equips you with a technical analysis for NGX stocks framework — what tools actually work, which timeframes to use, and how to combine technicals with fundamentals for a complete investment process.
If you haven’t already, start with Module 1 – NGX Basics, Module 2 – Investor Toolkit, and Module 3 – Fundamental Analysis before diving into this module.
Let’s build your technical analysis toolkit for the NGX.
1. Does Technical Analysis Actually Work on NGX? – Technical Analysis for NGX Stocks
This is a question that divides Nigerian investors sharply. Some say technical analysis is completely useless on the NGX. Others use it exclusively. The honest answer sits in the middle.
The Core Reality
Technical analysis is built on one core assumption: that price movements reflect the collective behaviour of all market participants, and that patterns in that behaviour repeat over time. This assumption holds best in markets with high liquidity — where thousands of participants are actively buying and selling at every moment, making prices a genuine reflection of collective sentiment.
The NGX, as you now know, is less liquid than major international exchanges. Many stocks trade a small number of shares on any given day. In low-liquidity conditions, a single large buyer or seller can move a price significantly — not because of any genuine shift in market sentiment, but simply because there are not enough opposing orders to absorb the trade.
Research supports this. Academic studies have found that momentum trading strategies generated significant profits for the Nigerian stock market relative to Egypt and South Africa. However, the same research ranked the Nigerian market as the least efficient among these markets, meaning prices do not always reflect all available information. Other studies have shown that the Nigerian stock market is not efficient and that logarithmic returns are not a random walk — suggesting that technical patterns can indeed be exploited.
When Technical Analysis Works Best on NGX
Technical analysis for NGX stocks works best under these specific conditions:
| Condition | Why It Works |
|---|---|
| High-cap, high-liquidity stocks | NGX 30 constituents have enough daily volume for price movements to reflect genuine sentiment |
| Weekly and monthly timeframes | Longer timeframes filter out noise from thin trading days |
| Post-earnings momentum plays | Strong results create fundamental moves that technicals can help time |
| Sector rotation signals | Entire sectors moving together reflect genuine macroeconomic forces |
Where Technical Analysis Fails on NGX
- Small-cap and penny stocks with negligible daily volume
- Stocks where price is being actively manipulated by coordinated buyers
- Daily timeframes for most stocks outside the top 20 by market cap
- When used in isolation without any fundamental filter
The Bottom Line
Your forex chart-reading skills are genuinely valuable on NGX — but only when applied to the right stocks, on the right timeframes, with fundamental analysis doing the heavy lifting first. This technical analysis for NGX stocks approach is what separates disciplined investors from gamblers.
2. Where to Chart NGX Stocks
Before anything else, you need to know where to access NGX stock charts. This is a practical gap many beginners fall into — they know how to analyze but cannot find the tools.
TradingView (Best Option)
TradingView is the best option available. Most NGX-listed stocks are available using their ticker symbols. Search for a stock by typing its ticker — for example, ZENITHBANK, DANGCEM, MTNN, GTCO. TradingView gives you full charting functionality including all the indicators you already know from forex trading. The free version is sufficient for everything covered in this module.
NGX Website
The NGX website (ngxgroup.com) provides basic price charts for every listed stock. They are not as feature-rich as TradingView but they are useful for quick reference and for checking historical price data.
Investing.com
Investing.com also carries NGX stock data and charts, searchable by ticker. Another reliable backup option.
Important Note
NGX data on some platforms has occasional gaps or delayed updates. Always cross-reference price data across two sources when precision matters — especially before making a significant investment decision.
3. The Chart Tools That Actually Work on NGX
You do not need a complex setup. In fact, the simpler your chart the better. Here are the tools that deliver genuine signal on NGX stocks rather than visual noise.
Tool 1 — Support and Resistance on Weekly and Monthly Charts
This is the single most reliable technical tool for NGX investing and the one you should master before anything else.
Support is a price level where buying interest has historically been strong enough to stop a stock from falling further. Resistance is a price level where selling pressure has historically been strong enough to prevent further rises. These levels form because human beings remember prices — institutional investors, fund managers, and large retail holders all have reference points where they previously bought or sold, and they tend to act around those same levels again.
On NGX weekly and monthly charts, support and resistance levels that have been tested multiple times over months or years are highly significant. When a fundamentally strong stock pulls back to a level that has held as support three or four times previously, you are looking at a potentially compelling entry point.
How to draw them: Identify price areas where the chart has clearly reversed direction multiple times. Draw a horizontal line at that level. The more times price has respected that level — bouncing off support or stalling at resistance — the stronger and more reliable it is.
Practical NGX application: Pull up a weekly chart of Zenith Bank, MTNN, or Dangote Cement going back three to five years. You will immediately see clearly defined support and resistance zones that price has respected repeatedly.
Tool 2 — The 50-Week and 200-Week Moving Averages
You are already familiar with moving averages from forex. On NGX, shift your timeframe to weekly rather than daily for meaningful signals.
The 50-week moving average (50WMA) represents the average closing price over the last 50 weeks — roughly one year. It smooths out short-term noise and shows you the medium-term trend direction.
The 200-week moving average (200WMA) represents approximately four years of average price history. It is the long-term trend indicator. When price is above the 200WMA, the long-term trend is up. When it is below, the long-term trend is down.
The Golden Cross and Death Cross
The classic signal that works across markets — including NGX — is the Golden Cross and the Death Cross:
| Signal | What Happens | Meaning |
|---|---|---|
| Golden Cross | 50WMA crosses above 200WMA | Shift from downtrend to uptrend — bullish |
| Death Cross | 50WMA crosses below 200WMA | Shift from uptrend to downtrend — bearish |
These crossovers do not happen often on weekly charts. That is precisely what makes them significant when they do.
Practical NGX application: On a longer-term position in a blue-chip NGX stock, use the 50WMA as a dynamic support level during uptrends. A weekly close decisively below the 50WMA is your first warning that something may be changing.
Tool 3 — Volume Analysis
Volume is the most underused tool by Nigerian stock market investors — and one of the most powerful when applied correctly.
Volume tells you how many shares changed hands during a period. It is the fuel behind price movements. A price rise accompanied by rising volume is a genuine, conviction-driven move. A price rise on very low volume is suspicious — it may not have the participation needed to sustain it.
The first half of 2026 stands out as one of the most active trading periods in recent years, with banking stocks as the foundation of liquidity. This makes volume analysis particularly valuable.
What to watch for specifically:
| Volume Pattern | What It Signals |
|---|---|
| Volume expansion on breakouts | Breakout above resistance on high volume is more likely to be genuine |
| Volume contraction during pullbacks | Selling is weak and unconvinced — often the most reliable entry point |
| Volume spikes without price movement | Accumulation — large buyers absorbing shares without pushing price up |
Practical NGX application: When a stock that normally trades 500,000 shares per day suddenly trades 5 million shares in a single session, something significant is happening. Institutional money is moving. This kind of volume spike, especially when it accompanies a breakout above resistance, is one of the clearest signals available on the NGX.
Tool 4 — RSI (Relative Strength Index) on the Daily Chart
The RSI measures the speed and magnitude of recent price changes to evaluate whether a stock is overbought or oversold. You already know this indicator from forex — the application on NGX is similar but with important caveats.
Use RSI on the daily chart for NGX, not the 4-hour or 1-hour timeframes you might use in forex. The additional time smoothing reduces the noise from thin trading days.
Standard interpretation:
| RSI Level | Meaning |
|---|---|
| Above 70 | Overbought — stock may be due for a pullback |
| Below 30 | Oversold — stock may be due for a bounce |
In April 2026, RSI crossed significantly into overbought levels as the NGX surged past 242,000 points, which technical analysts identified as an early indication that the market may be approaching a short-term peak.
However — and this is critical for NGX — RSI alone is not a buy or sell signal. A stock can remain overbought for weeks during a strong uptrend driven by genuine fundamental catalysts. A stock can remain oversold for months if the underlying business is genuinely deteriorating.
The most useful RSI application on NGX is divergence:
| Divergence Type | What It Signals |
|---|---|
| Bearish divergence | Price makes new high, RSI makes lower high → upward momentum weakening |
| Bullish divergence | Price makes new low, RSI makes higher low → selling pressure exhausting |
Combined with a fundamentally strong stock at a key support level, bullish divergence on the RSI daily chart is one of the more reliable entry signals available.
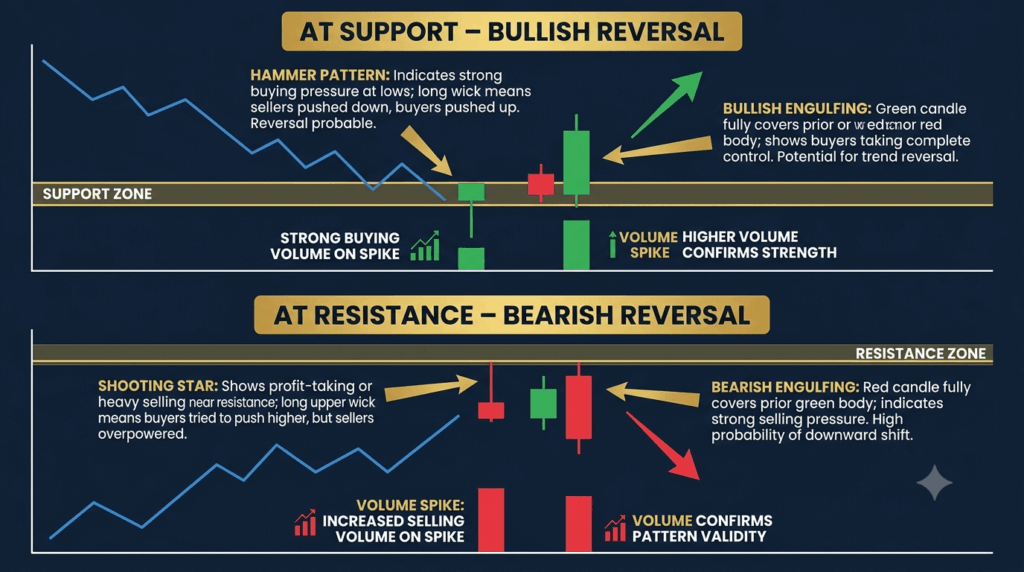
Tool 5 — Candlestick Patterns at Key Levels
Your forex background gives you a significant advantage here. Candlestick pattern reading is one of the most transferable skills from forex to stocks.
The patterns that matter most on NGX are not the complex multi-candle formations. They are the simple, high-conviction reversal signals at key levels.
| Pattern | Where It Occurs | What It Signals |
|---|---|---|
| Hammer / Inverted Hammer | At support | Potential reversal from downtrend |
| Bullish Engulfing | At support | Aggressive buying overwhelming sellers |
| Shooting Star | At resistance | Buyers failed to hold gains |
| Bearish Engulfing | At resistance | Sellers have regained control |
One important reminder: on NGX, always check the volume on the candle where you see a pattern. A beautiful bullish engulfing pattern on near-zero volume is unreliable. The same pattern with volume three times the daily average is a genuinely significant signal.
4. The NGX Hybrid Approach: Fundamentals First, Technicals Second
This is the complete framework — the integration of everything from Module 3 and Module 4 into one coherent investment process. It is the approach that separates disciplined investors from gamblers, and it is specifically designed for the NGX environment.
The core principle is simple: fundamentals tell you what to buy, technicals tell you when to buy it.
Phase 1 — Fundamental Screening
Begin with the screening process from Module 3. Input data from recent annual reports for stocks you are considering. Identify which companies are fundamentally strong — growing revenue and earnings, healthy ratios, consistent dividends, manageable debt, strong ROE.
At this stage you are building a watchlist — not buying anything yet. You want a list of perhaps 8 to 12 companies that pass your fundamental test. These are the businesses you want to own. Now you need to find the right moment to buy them.
Phase 2 — Technical Entry Timing
For each stock on your fundamental watchlist, open the weekly chart on TradingView. Identify the key support and resistance levels. Note where the 50WMA and 200WMA are sitting. Check the volume trend. Look at the RSI on the daily chart.
You are now asking one question: is this fundamentally strong stock currently at a price level that offers a good entry, or has it already run significantly and is now extended?
The ideal entry conditions:
- Stock has pulled back from a recent high and is approaching a well-established support level
- Volume has been declining during the pullback, suggesting weak selling
- RSI has come down from overbought levels and is now in the 40–55 range
- 50WMA is rising and price is above it
- A candlestick reversal pattern forms at the support level with expanding volume
When these conditions align for a fundamentally strong company, you have the highest-probability setup available on the NGX. You are not guessing. You are not acting on a tip. You are entering a quality business at a technically favorable price, with both disciplines confirming your decision.
Phase 3 — Position Sizing
Before you place any order, decide exactly how much of your portfolio you are willing to put into this one stock. As a general guide, no single stock should represent more than 20% of your portfolio when you are starting out. Most experienced investors keep individual positions between 8% and 15%.
Your entry price is defined by your technical analysis — the support level or reversal candle that triggered your entry. Your exit price if wrong — your stop loss — is defined by a clear level below which your technical thesis is invalid. For a long-term NGX investor this might be a weekly close below a major support level, or a sustained break below the 200WMA.
Knowing both your entry and your exit before you press the buy button is not optional. It is the difference between investing and gambling.
Phase 4 — Monitoring Your Position
Once you are in a position, your job becomes monitoring rather than reacting. Check the weekly chart once per week — not the daily chart every hour. Long-term investing on NGX rewards patience.
There are only three things that should make you reconsider an existing position:
- The fundamental thesis changes — the company releases results that show genuine deterioration
- A technical signal on the weekly chart suggests the trend has shifted — specifically a weekly close below major support or the 200WMA
- A better opportunity appears elsewhere that warrants reallocating capital
Everything else is noise. Learn to ignore it.
5. Putting It All Together: A Real Example Walkthrough
Let us walk through how you would apply this hybrid approach to a real scenario using the type of analysis this framework demands. The company names used here are for illustration — this is not a buy recommendation.
Imagine you run your fundamental screening from Module 3 and a leading bank scores strongly — growing EPS over the past four years, dividend yield above 8%, ROE above 20%, debt well-managed, positive operating cash flow. Fundamentally, it passes your test. You add it to your watchlist.
You open the weekly chart on TradingView. You notice that over the past two years, a specific price level has served as support twice — price approached it, reversed, and moved higher both times. Currently the stock has pulled back from recent highs and is approaching that support zone. Volume during the pullback has been declining — sellers are not panicking, they are simply taking profits on the recent move. RSI on the daily chart has cooled from overbought territory down to neutral. The 50WMA is rising and price remains above it.
You do not buy immediately. You set a price alert just inside the support zone. A few sessions later, price reaches the support level and a hammer candlestick forms on the daily chart, with volume running at twice the recent average. The RSI is now approaching but not yet at oversold.
Your fundamental thesis says this is a quality company. Your technical analysis says price is at a historically significant support level with buying interest appearing on above-average volume. All conditions align.
You place a limit order to buy at the support level. You define your stop loss as a weekly close below the support zone — which would tell you your technical thesis is wrong. You size your position so that if your stop loss is hit, your total loss represents no more than 3% of your overall portfolio.
This is disciplined, process-driven investing. Not a tip. Not a guess. Not FOMO. A structured decision made with both fundamental and technical evidence pointing in the same direction.
6. Sector Performance Context for Technical Analysis
Understanding sector performance helps contextualise your technical analysis. Here is how key NGX sectors performed through mid-2026:
| Sector | YTD Performance (as of July 10, 2026) |
|---|---|
| Oil & Gas | 96.80% – Best performing index |
| Industrial Goods | 88.73% |
| Banking | 41.78% |
| All-Share Index | 56.67% |
| Insurance | -4.74% – Only index in negative territory |
Technical insight: The Insurance Index’s -4.74% YTD performance illustrates why sector context matters — a stock may show a beautiful technical pattern, but if the entire sector is underperforming, the odds of a sustained breakout are lower. Conversely, in a strongly performing sector like Oil & Gas (96.80% YTD), technical breakouts are more likely to be sustained.
7. Action Plan: Applying the Technical Analysis Framework
Now that you understand the technical analysis for NGX stocks framework, here is your practical action plan.
Step 1: Build your fundamental watchlist.
Use Module 3’s framework to identify 8–12 fundamentally strong companies.
Step 2: Open weekly charts on TradingView.
For each stock, identify key support and resistance levels going back 3–5 years.
Step 3: Add moving averages.
Plot the 50WMA and 200WMA. Note where price sits relative to these levels.
Step 4: Monitor volume.
Check the average daily volume and look for unusual spikes or contractions.
Step 5: Watch RSI on the daily chart.
Look for divergence signals and overbought/oversold conditions.
Step 6: Wait for alignment.
Only enter when multiple technical signals align with your fundamental thesis.
Step 7: Set your stop loss before entry.
Define your exit if wrong before you press buy.
Step 8: Check in weekly, not daily.
Monitor on weekly charts. Ignore daily noise.
8. Module 4 — Quick Summary
| Concept | What You Now Know |
|---|---|
| TA on NGX — when it works | High-cap stocks, weekly/monthly timeframes, post-earnings moves, sector rotation |
| TA on NGX — when it fails | Small-caps, thin volume, daily timeframes, used without fundamentals |
| Where to chart | TradingView (best), NGX website, Investing.com |
| Support & resistance | Most reliable tool on NGX — use weekly and monthly charts |
| Moving averages | 50WMA and 200WMA on weekly charts for trend direction |
| Golden Cross | 50WMA crosses above 200WMA — bullish signal |
| Death Cross | 50WMA crosses below 200WMA — bearish signal |
| Volume analysis | Most underused tool — confirms whether price moves are genuine |
| RSI application | Use on daily chart as supporting signal — divergence is most powerful |
| Candlestick patterns | Hammer, bullish engulfing at support — always confirm with volume |
| The hybrid approach | Fundamentals screen what to buy — technicals time when to buy it |
| Position management | Weekly chart check-ins, three defined exit conditions, ignore daily noise |
9. Final Summary & The Bottom Line
Technical analysis for NGX stocks is a powerful tool — but only when applied selectively and combined with fundamental analysis. The NGX’s lower liquidity makes daily chart patterns unreliable for most stocks, but weekly and monthly timeframes on high-cap, high-liquidity stocks can provide genuinely valuable entry signals.
text
  ┌──────────────────────────────────────────────────────────┐
  │     TECHNICAL ANALYSIS FOR NGX STOCKS – KEY TAKEAWAYS    │
  ├─────────────────────┬────────────────────────────────────┤
  │ When TA works       │ NGX 30, weekly/monthly timeframes │
  ├─────────────────────┼────────────────────────────────────┤
  │ Best tool           │ Support & resistance on weekly    │
  │                     │ charts                           │
  ├─────────────────────┼────────────────────────────────────┤
  │ Moving averages     │ 50WMA and 200WMA for trend       │
  ├─────────────────────┼────────────────────────────────────┤
  │ Most underused      │ Volume analysis – confirms        │
  │                     │ genuine moves                    │
  ├─────────────────────┼────────────────────────────────────┤
  │ RSI application     │ Daily chart, divergence signals  │
  ├─────────────────────┼────────────────────────────────────┤
  │ The hybrid approach │ Fundamentals first, technicals   │
  │                     │ second                          │
  └─────────────────────┴────────────────────────────────────┘
The Bottom Line:
The Nigerian stock market has delivered exceptional returns in 2026, with the ASI reaching 246,183.96 points and YTD returns exceeding 58%. The market is the strongest frontier equity market globally this year. Yet the NGX’s liquidity challenges — where beyond the top 30 stocks, liquidity is a “ghost” — mean that technical analysis must be applied with discipline.
The most successful NGX investors are not those who trade frequently or chase the hottest tips. They are those who combine fundamental analysis (what to buy) with technical analysis (when to buy it) into a single, disciplined process. They understand that technicals without fundamentals are gambling, and fundamentals without technicals are blind.
For more weekly NGX updates and strategy guides, explore our market trends and analysis archive.
Coming up in Module 5: How to actually pick NGX stocks — the complete selection framework, the NAIRA method for evaluating any company, a sector-by-sector analysis for 2026, and a practical walkthrough of how to research specific stocks from start to finish using everything you have learned so far.
Disclaimer: This article is for informational purposes only and does not constitute investment advice. Always conduct your own research or consult a qualified financial advisor before investing. Past performance does not guarantee future results.