
NGX Resources & Tools: Your Complete Investor Toolkit (Bonus Module)
By Market Formula Editorial Team / August 2026
Introduction
You have now completed all seven core modules of the Nigerian Stock Market Starter Kit. You understand how the NGX works, how to open a brokerage account, how to analyze companies fundamentally and technically, how to build a diversified portfolio, and how to avoid the common mistakes that destroy beginner portfolios.
But knowledge without execution is incomplete. This bonus module equips you with the resources and tools you need to turn your knowledge into ongoing action—where to find reliable financial data, when to expect earnings releases, which websites to trust for market news, and a powerful Excel Screener that automates your analysis.
The Nigerian stock market has delivered exceptional returns in 2026. The NGX All-Share Index is hovering around 247,000 points, approaching record highs, with market capitalisation at approximately N158.3 trillion. Year-to-date returns have exceeded 57%. However, success in this market depends not just on knowing what to do, but on having the right tools to do it consistently.
This bonus module covers:
- Where to find NGX financial reports for free
- The NGX economic calendar: when earnings seasons occur
- Useful websites for Nigerian investors
- A glossary of 30 essential stock market terms
- The Excel Screener Tool—a complete five-tab analysis system
Let’s build your complete investor toolkit.
1. Where to Find NGX Financial Reports (Free)
Before you can analyze any company, you need access to its financial statements. Fortunately, Nigerian listed companies are required to publish their results publicly, and multiple free sources exist.
The NGX Disclosure Portal
The NGX website (ngxgroup.com) is the primary source for all official company announcements. Navigate to the Investor Relations or Disclosures section to find every financial result announced by listed companies. Every quarterly result, annual report, and corporate action is posted here as soon as it is released.
The NGX also provides an Investor Relations Data Pack that helps promote the fair valuation of companies and helps investors access standardized financial data. NGX Group itself has published its 2024 and 2025 Annual Reports on the site, with the 2025 report available as a downloadable PDF.
Company Investor Relations Pages
Every publicly traded company in Nigeria maintains an Investor Relations page on its corporate website. These pages typically offer:
- Annual reports as downloadable PDFs
- Quarterly results
- Investor presentations
- Corporate governance documents
These reports are often more detailed than the exchange filings, with additional commentary from management.
Financial News Platforms
Nairametrics provides comprehensive coverage of business, finance, and economic developments with insightful articles, market analysis, and real-time updates. Proshare and BusinessDay are also reputable sources for financial news and analysis. BusinessDay Media has been ranked among the top business and financial digital platforms in Nigeria in terms of web traffic, social media influence, and audience engagement.
The NGX Reporting Calendar
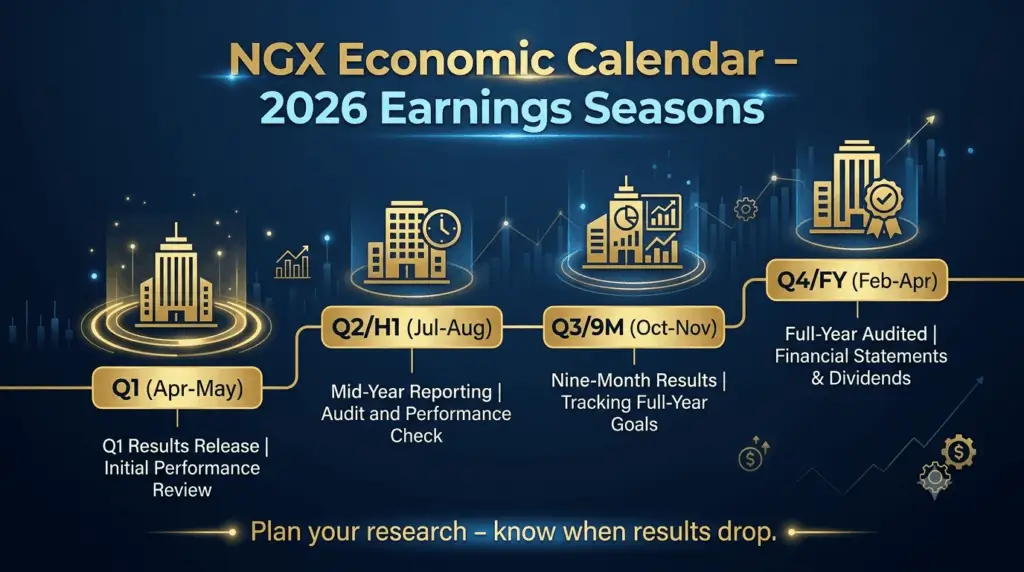
Nigerian companies are required to publish results on a specific schedule. Knowing this schedule helps you plan your research:
| Period | Filing Window |
|---|---|
| First Quarter (Q1) | Mid-April to end of May |
| Half Year (H1) | Mid-July to end of August |
| Nine Months (9M) | October to November |
| Full Year / Annual | February to April of the following year |
The first quarter (Q1) ends on March 31, so earnings season often begins in mid-April and runs until the end of May for late filers. The second quarter (Q2) ends on June 30, with earnings season beginning in mid-July and running until the end of August.
The financial services sector consistently leads in trading volume, value, and deals executed. The first half of 2026 stands out as one of the most active trading periods in recent years for the NGX.
2. Useful Websites for Nigerian Investors
Having the right websites bookmarked can save you hours of research time. Here are the essential resources every Nigerian investor should know.
NGX Group (ngxgroup.com)
The official website of the Nigerian Exchange Group. This is your primary source for:
- Company disclosures and financial results
- Trading data and market statistics
- Corporate actions and dividend announcements
- NGX rules and regulations
- Investor education materials
The NGX has also released NGX StockTown, a unique comic book designed to promote financial literacy among Nigerian youths. It is available in both print and digital formats, and interested readers can download the magazine from the NGX website. StockTown leverages illustrated characters and storytelling to impart valuable lessons about the significance of savings and investment.
Securities and Exchange Commission Nigeria (sec.gov.ng)
The SEC is the regulator of the Nigerian capital market. Their website offers:
- Investor education programs to elevate financial literacy and help investors confidently navigate the capital market
- An Investors Hub with guides, reports, and tools
- A comprehensive FAQs section
- Resources including forms, templates, checklists, papers, and publications
The SEC also maintains an Investor Community—an online platform for networking, learning, and sharing insights with fellow investors, with access to curated content moderated by SEC experts.
Nairametrics (nairametrics.com)
A leading financial news website in Nigeria, offering comprehensive coverage of business, finance, and economic developments. It is an excellent source for:
- Market analysis and commentary
- Company results summaries
- Economic indicators and policy updates
- Real-time financial news
Proshare (proshare.co)
A long-established financial information platform in Nigeria. Proshare provides:
- In-depth market analysis
- Company research and financial data
- Industry reports and economic commentary
- Investor education content
BusinessDay (businessday.ng)
Nigeria’s leading business newspaper. BusinessDay offers:
- Daily business and financial news
- Market analysis and opinion pieces
- Economic data and policy coverage
- Sector-specific reporting
3. Glossary of 30 NGX/Stock Market Terms in Plain English
Understanding the language of the stock market is essential for making informed decisions. This glossary covers the 30 most important terms you will encounter as an NGX investor.
Basic Terms
1. All-Share Index (ASI)
The single number that tells you how the entire Nigerian stock market is performing on any given day. It serves as your benchmark for measuring portfolio performance.
2. Annual General Meeting (AGM)
A yearly meeting where a company’s shareholders vote on key decisions, approve financial statements, and hear from management.
3. Bear Market
A prolonged period of declining stock prices, typically defined as a 20% or more drop from recent highs.
4. Blue-Chip Stocks
Shares of large, well-established, and financially stable companies with a history of reliable performance and dividend payments. Examples include Dangote Cement, MTN Nigeria, and Zenith Bank.
5. Bonus Issue
When a company gives existing shareholders additional shares for free, usually in proportion to their current holdings.
6. Brokerage Commission
The fee you pay to your stockbroker for executing a trade. This is typically a percentage of the transaction value.
7. Bull Market
A prolonged period of rising stock prices, typically characterized by investor optimism and economic growth.
8. Capital Appreciation
The increase in the value of a stock over time. This is one of the two primary ways investors make money (the other being dividends).
9. Corporate Action
Any event that changes a company’s structure or finances, such as dividend declarations, rights issues, bonus issues, or mergers.
10. Correction
A decline of 10% or more from a recent peak in stock prices. Corrections are normal market events and often present buying opportunities.
Financial Statements & Metrics
11. Dividend
A cash payment made by a company to its shareholders from its profits. Dividends are typically paid per share and are a primary source of income for many Nigerian investors.
12. Dividend Yield
The annual dividend per share divided by the current share price, expressed as a percentage. It tells you the cash income return you receive from holding the stock.
13. Earnings Per Share (EPS)
Profit After Tax divided by the total number of shares. EPS tells you how much profit the company generated for each share in existence.
14. Earnings Season
The period when companies release their quarterly or annual financial results. In Nigeria, Q1 results are typically released in April–May, and H1 results in July–August.
15. Ex-Dividend Date
The date after which a buyer of the stock is not entitled to receive the upcoming dividend. To receive a dividend, you must hold the shares before this date.
16. Free Float
The percentage of a company’s shares that are available for public trading, excluding shares held by insiders, promoters, or strategic investors.
17. Market Capitalization (Market Cap)
The total value of a company on the stock exchange, calculated as Share Price × Total Number of Shares.
18. Net Interest Margin (NIM)
A measure of the difference between the interest income a bank earns from loans and the interest it pays on deposits. Higher NIM indicates better profitability.
19. Price-to-Book Ratio (P/B)
Share Price divided by Book Value Per Share. A P/B below 1.0 suggests the stock may be undervalued relative to its assets.
20. Price-to-Earnings Ratio (P/E)
Share Price divided by Earnings Per Share. It tells you how much the market is willing to pay for every naira of profit the company earns.
21. Profit After Tax (PAT)
A company’s net profit after all expenses, interest, and taxes have been deducted. This is the “bottom line” that drives dividends and EPS.
22. Return on Equity (ROE)
Profit After Tax divided by Shareholders’ Equity, expressed as a percentage. ROE measures how efficiently management uses shareholder capital to generate profit.
Trading & Market Mechanics
23. CSCS Account
Your Central Securities Clearing System account—the digital vault where your shares are held. Every NGX investor has a unique CSCS number.
24. CSCS USSD Code (*7270#)
A service that allows investors to retrieve their Clearing House Number (CHN), check their Direct Cash Settlement (DCS) status, view stock positions, confirm account balances, and verify account status—all without needing a smartphone or internet connection.
25. Golden Cross
A bullish technical signal that occurs when the 50-week moving average crosses above the 200-week moving average, indicating a shift from downtrend to uptrend.
26. Limit Order
An order to buy or sell a stock only at a specific price you set. It gives you price control but requires patience.
27. Liquidity
How easily you can buy or sell a stock without significantly affecting its price. Stocks with high liquidity (like those in the NGX 30) are easier to trade.
28. Market Order
An order to buy or sell a stock immediately at the current available price. It executes quickly but you have no control over the exact price.
29. Rights Issue
When a company offers existing shareholders the opportunity to buy new shares at a discount to the current market price, usually to raise capital for expansion or restructuring.
30. T+1 Settlement Cycle
Effective June 1, 2026, the NGX became the first market in Africa to implement a one-day settlement framework for equities and commodities. Trades now settle one business day after the trade date.
4. Excel Screener Tool — Full Specification
The Excel Screener is a powerful tool designed to automate your stock analysis and portfolio tracking. It consists of five interconnected tabs, each serving a specific purpose.
Tab 1 — Stock Screener Dashboard
This is your primary analysis tool. You input raw financial data from annual reports, and the screener automatically calculates key ratios and color-codes them for easy interpretation.
Input Fields (Manual Entry):
- Company name & ticker
- Current share price
- EPS (last 12 months)
- Book value per share
- Dividends per share (last year)
- Total debt
- Total equity
- Net profit
- Revenue (current year vs. prior year)
Auto-Calculated Outputs (Pre-Built Formulas):
| Output | Formula | Color Code |
|---|---|---|
| P/E Ratio | Share Price ÷ EPS | Green = Attractive, Yellow = Fair, Red = Expensive |
| P/B Ratio | Share Price ÷ Book Value | Green = Attractive, Yellow = Fair, Red = Expensive |
| Dividend Yield % | Dividend ÷ Share Price × 100 | Green = High Yield |
| ROE % | Net Profit ÷ Total Equity × 100 | Green = Strong (>15%), Red = Weak (<10%) |
| Debt-to-Equity | Total Debt ÷ Total Equity | Green = Low Debt (<1.0), Red = High Debt (>2.0) |
| Revenue Growth % | (Current Revenue ÷ Prior Revenue – 1) × 100 | Green = Positive, Red = Negative |
| Profit Growth % | (Current Profit ÷ Prior Profit – 1) × 100 | Green = Positive, Red = Negative |
| Overall Score | Weighted formula combining all ratios | Score out of 10 |
The weighted formula gives more importance to metrics that matter most for your investment style. For example, income-focused investors might weight dividend yield more heavily, while growth investors might weight revenue growth and ROE.
Tab 2 — Portfolio Tracker
This tab helps you monitor all your holdings in one place.
Input Fields:
- Stock name
- Number of shares owned
- Buy price
- Current price
Auto-Calculated Outputs:
- Current value (Shares × Current Price)
- Gain/Loss in ₦ (Current Value – Cost Basis)
- Gain/Loss % (Gain/Loss ÷ Cost Basis × 100)
- Dividend income tracker (record each dividend received)
- Total portfolio value
- Total return including dividends
- % allocation per stock (auto-generated pie chart)
The portfolio tracker gives you a complete picture of your portfolio’s performance at a glance. You can see which positions are your biggest winners, which are lagging, and how your portfolio is diversified.
Tab 3 — Watchlist
This tab helps you monitor stocks you are interested in but have not yet bought.
Input Fields:
- Up to 20 stocks to monitor
- Notes column: “Waiting for Q2 results”, “Watching for pullback to ₦22”
- Buy target price column
- Alert threshold (highlight when price reaches target)
Auto-Calculated Outputs:
- Automatic highlighting when price reaches your target
- Color-coded alerts for price movements
The watchlist keeps your research organized and ensures you never miss a buying opportunity for stocks you have already vetted.
Tab 4 — Sector Comparison Tool
This tab helps you compare stocks within the same sector to identify the strongest value.
Input Fields:
- Up to 5 stocks in the same sector
- Key ratios for each stock (P/E, P/B, Dividend Yield, ROE, D/E)
Auto-Calculated Outputs:
- Side-by-side ratio comparison
- Auto-highlights the strongest stock in each metric
- Answers the question: “Which bank stock is cheapest right now?”
For example, if you are considering five banking stocks, this tool will instantly show you which one has the lowest P/E, highest dividend yield, best ROE, and lowest debt. This makes sector-level comparisons effortless.
Tab 5 — Dividend Income Planner
This tab helps you plan and project your dividend income.
Input Fields:
- Number of shares owned per stock
- Dividend per share (projected or historical)
Auto-Calculated Outputs:
- Projected annual dividend income in ₦
- “How much do I need to earn ₦500,000/year from dividends?” reverse calculator
- Reinvestment projector: Shows how compounding dividends grow over 5 years
The reverse calculator is particularly useful. If you want to earn ₦500,000 per year in dividends and the average dividend yield of your portfolio is 8%, you would need approximately ₦6.25 million invested. The calculator does this math for you automatically.
The reinvestment projector shows you how reinvesting dividends accelerates wealth creation. For example, if you invest ₦1 million in a stock yielding 8%, and you reinvest all dividends, after 5 years your portfolio value would be significantly higher than if you had taken the dividends as cash.
5. Action Plan: Using Your NGX Resources & Tools
Now that you understand the resources and tools available, here is your practical action plan.
Step 1: Bookmark essential websites.
- NGX Group (ngxgroup.com) – for official disclosures
- SEC Nigeria (sec.gov.ng) – for investor education and regulation
- Nairametrics (nairametrics.com) – for news and analysis
- Proshare (proshare.co) – for in-depth research
- BusinessDay (businessday.ng) – for daily business news
Step 2: Set up your Excel Screener.
- Download the template and input data for your watchlist stocks
- Review the color-coded outputs to identify strong and weak candidates
- Update quarterly after each earnings season
Step 3: Build your portfolio tracker.
- Input all your current holdings
- Track your total return including dividends
- Monitor your sector allocation
Step 4: Create your watchlist.
- Add 10–20 stocks you are researching
- Set buy targets and price alerts
- Add notes on your investment thesis
Step 5: Plan your dividend income.
- Use the Dividend Income Planner to project your annual income
- Set a target and calculate how much you need to invest
- Project the impact of reinvesting dividends over 5 years
6. Final Summary & The Bottom Line
This bonus module has equipped you with the resources and tools you need to succeed as an NGX investor. From finding financial reports to using the Excel Screener, you now have everything you need to turn knowledge into consistent action.
text
  ┌──────────────────────────────────────────────────────────┐
  │        NGX INVESTOR RESOURCES & TOOLS – KEY TAKEAWAYS    │
  ├─────────────────────┬────────────────────────────────────┤
  │ Financial Reports   │ NGX Disclosure Portal, Company    │
  │                     │ IR pages, Nairametrics, Proshare  │
  ├─────────────────────┼────────────────────────────────────┤
  │ Economic Calendar   │ Q1: Apr-May | H1: Jul-Aug |       │
  │                     │ 9M: Oct-Nov | FY: Feb-Apr        │
  ├─────────────────────┼────────────────────────────────────┤
  │ Key Websites        │ NGX Group, SEC Nigeria,           │
  │                     │ Nairametrics, Proshare,           │
  │                     │ BusinessDay                      │
  ├─────────────────────┼────────────────────────────────────┤
  │ Excel Screener      │ 5 tabs: Screener, Portfolio,      │
  │                     │ Watchlist, Sector Compare,        │
  │                     │ Dividend Planner                  │
  ├─────────────────────┼────────────────────────────────────┤
  │ 30-Term Glossary    │ Essential terms from ASI to       │
  │                     │ T+1 settlement                   │
  └─────────────────────┴────────────────────────────────────┘
The Bottom Line:
The Nigerian stock market offers genuine wealth-building opportunities, but success requires more than just knowledge—it requires the right tools and resources to execute consistently. The NGX Disclosure Portal, SEC Investor Education, Nairametrics, Proshare, BusinessDay, and the Excel Screener together form a complete investor toolkit.
The Excel Screener, in particular, transforms manual analysis into an automated, color-coded process. It helps you identify undervalued stocks, track your portfolio, monitor watchlist candidates, compare stocks within sectors, and plan your dividend income—all in one place.
Your Next Steps:
- Download the Excel Screener and input data for your watchlist stocks
- Bookmark the key websites for daily market updates
- Mark your calendar for the upcoming earnings seasons
- Use the glossary as a reference whenever you encounter unfamiliar terms
- Stay disciplined—the tools are only as good as the discipline with which you use them
For more weekly NGX updates and strategy guides, explore our market trends and analysis archive.