
NGX Market Review & Outlook: Navigating the H1 Earnings Season After a 0.84% Pullback
By Kebira Aruna FCS FiCM. MD/CEO, Globalview Capital Limited / Aug 03, 2026
Introduction
The Nigerian equities market closed the last week of July on a negative note, with the NGX All-Share Index (ASI) declining by 0.84% to settle at 245,283.68 points. Market capitalisation eased by 0.79% to ₦158.326 trillion, as investors booked profits following the market’s sustained rally throughout the month.
Despite the weekly pullback, July 2026 was a remarkable month for Nigerian equities. The market added approximately ₦11.11 trillion to investors’ wealth, recovering significantly from the over ₦13 trillion losses recorded in June. The ASI advanced 6.92% during the month, while the market capitalisation rose 7.55% from N147.22 trillion. Year-to-date, the stock market has recorded N58.97 trillion in gains, with the ASI returning an impressive 57.62%.
The NGX market review Q2 earnings season is now in full swing, with investors closely monitoring audited H1 2026 results and interim dividend declarations. This guide breaks down what is driving the current market dynamics, the performance of Q2 earnings releases, the outlook for the new week, and specific stocks to watch.
Let’s examine the NGX market review Q2 earnings with clarity and strategic discipline.
1. Market Structure: What Drove the 0.84% Pullback?
The modest weekly decline reflects standard profit-taking and structural consolidation within an ongoing macro recovery cycle. Despite the index drop, trading activity strengthened significantly, with investors exchanging a total turnover of 5.119 billion shares worth ₦404.762 billion — a 32% surge from the previous week. This indicates active liquidity and sector rotation rather than broad panic selling.
Primary Drivers Behind the Pullback
Sector Performance in July
| Sector | Monthly Performance |
|---|---|
| Banking Index | +22.10% — Standout performer |
| Insurance Index | +9.29% |
| Industrial Index | +3.57% |
| Oil & Gas Index | +3.21% |
| Consumer Goods Index | -4.11% — Only sector in negative territory |
First HoldCo Plc was the best-performing stock in July, with its share price rising from N56.05 to N129.55 — a 131.13% monthly gain. Airtel Africa also delivered strong performance, rising 21% to N5,801.40. The Banking Index emerged as the standout performer, climbing from 2,070.11 points at the end of June to 2,527.59 points by July 31.
2. Q2 & H1 2026 Earnings Performance: A Mixed Bag
The Q2 and H1 2026 earnings batch released to the NGX during the last week of July can be rated as robust on top-line growth, but divergent on bottom-line earnings quality. While market-wide revenues expanded across most sectors due to higher transaction volumes and pricing power, net profit outcomes reflected clear operational bifurcation across sectors.
Standout Performers
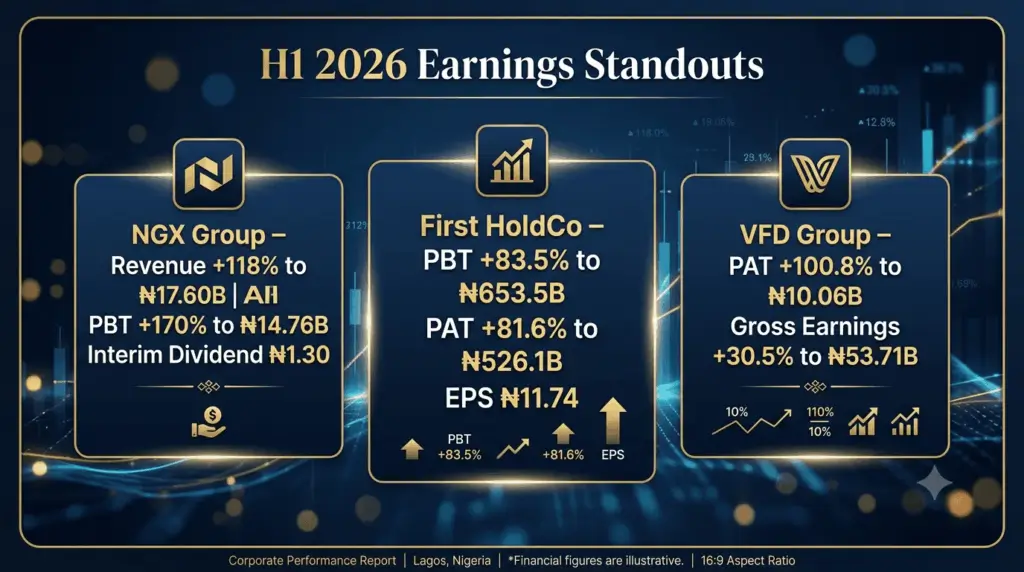
NGX Group Plc delivered a record-breaking H1 2026 performance. Revenue surged 118% to ₦17.60 billion, while Profit Before Tax (PBT) jumped 170% to ₦14.76 billion. Total income reached ₦19.34 billion, a 96% increase. The board declared an interim dividend of ₦1.30 per share. Transaction fees surged by 169% to ₦13.34 billion, while listing fees grew 59% to ₦2.38 billion. Profit after tax climbed 146% to ₦10.36 billion.
First HoldCo Plc reported gross earnings of ₦1.93 trillion, up 16.7% year-on-year, while Profit Before Tax surged 83.5% to ₦653.5 billion. Profit after tax climbed 81.6% to ₦526.1 billion. Earnings per share rose to ₦11.74, up from ₦6.84. Non-interest income soared 162.5% to ₦497.1 billion from N189.4 billion a year earlier. Impairment charges fell 37.4% to ₦116.1 billion, while the group recovered approximately ₦91.9 billion from previously impaired assets. The cost-to-income ratio improved to 44.2% from 50.5%, and total assets expanded to ₦30.65 trillion.
Tier-1 Banking Sector
Earnings remained strong on the back of elevated interest rates boosting Net Interest Margins (NIMs). However, market reaction was somewhat tempered as investors scrutinised cost-to-income ratios and provisions ahead of full H1 audited releases from major lenders.
Zenith Bank has scheduled its Board meeting to consider H1 2026 audited financial statements and recommend an interim dividend, while Access Holdings reported resilient Q1 performance with Profit After Tax rising 19% year-on-year to N216.5 billion.
Consumer Goods & Industrial Goods
Top-line growth across major consumer counters was sustained by price adjustments. However, sticky operating costs, energy overheads, and finance expenses continued to squeeze net profit margins. Dangote Cement reported a strong H1 2026 performance with group revenue increasing 21.4% to N2.514 trillion and profit after tax rising 22.7% to N638.5 billion. EBITDA rose 25.8% to N1.188 trillion, reflecting a margin of 47.3%. The company grew cement and clinker exports from Nigeria by 62.3% to 1.1 million tonnes.
Insurance & Growth Stocks
Tickers with muted Q2 earnings or delayed growth catalysts experienced sharp pullbacks as institutional capital rotated out of mid-cap insurance and growth names into high-dividend tier-1 banks.
3. Outlook for the New Week: Cautious Optimism
The outlook for the new week points toward cautious optimism and heightened sector rotation, with market activity shifting from broad speculative buying to disciplined, stock-specific positioning.
Key Factors Shaping Trading Performance
1. Audited H1 Earnings & Interim Dividend Drivers
Investors will closely monitor the remaining audited H1 releases—particularly from Tier-1 banks (FUGAZ) and telecom giants. Dividend disclosures will act as immediate catalysts for capital allocation, with high-yield counters drawing institutional inflows.
2. Selective Bargain Hunting
Following the 0.84% dip in the All-Share Index, fund managers are expected to pick up fundamentally strong blue-chip and mid-cap stocks that were overextended in late July. With the Banking Index up 22.10% in July, some profit-taking is expected in the short term, but fundamentally sound banks remain accumulation targets.
3. Fixed-Income Competition
With the Central Bank of Nigeria maintaining a hawkish stance and money market yields remaining attractive (MPC benchmark at 26.50%), debt instruments will continue to compete with equities for liquid capital, keeping overall index gains measured.
4. Focus on Oil & Gas and Industrial Leaders
Elevated crude oil production and stable pricing favour energy majors. Seplat Energy continues to offer dollar-denominated dividends, while blue-chip industrials with dominant market share will remain core holdings as macro conditions stabilise.
       ┌────────────────────────────────────────────────────────┐
       │        NGX OUTLOOK – KEY FACTORS FOR THE NEW WEEK      │
       └───────────────────────────┬────────────────────────────┘
                                   │
         ┌─────────────────────────┼─────────────────────────┐
         ▼                         ▼                         ▼
  [ H1 EARNINGS ]           [ BARGAIN HUNTING ]        [ FIXED INCOME ]
  Interim dividends         Quality stocks at          Competition
  drive capital             attractive entry           caps index
  allocation                levels                     gains
4. What Is Driving the Growth in CMFC, Consolidated Hallmark, LASACO and VFD Group?
The growth and positive momentum in these four stocks are driven by a combination of corporate restructurings, strong financial turnarounds, and broader sector rotation.
Critical Minerals Financing Corp Plc / CMFC (formerly DEAP Capital)
Shareholders approved a corporate transformation from DEAP Capital Management & Trust Plc into Critical Minerals Financing Corporation Plc to position the firm as a specialised private-sector mining finance institution. The company approved a massive share capital expansion, allotting over 7 billion new shares to strategic private equity investors to restructure its balance sheet. Investor interest has soared, propelling the stock over 100% higher year-to-date. CMFC led the gainers’ chart with a 22.78% appreciation to close at ₦3.88.
Consolidated Hallmark Holdings Plc
The transition from a standalone insurance company to a non-operating Holding Company structure has unlocked operational efficiencies across its insurance, finance, and healthcare subsidiaries. The company tripled its after-tax profit to N20.3 billion in Q1 2026. The group also announced a final dividend of 15 kobo per share.
LASACO Assurance Plc
LASACO Assurance reported a three per cent decline in insurance revenue for H1 2026 to N16.35 billion, but its net insurance and investment results improved by 75%, leading to a substantial increase in pre-tax profit. Insurance service expenses were cut by 17%, and net expenses from reinsurance contracts were reduced by 11.4%, driving insurance service results to N3.1 billion from N1.1 billion a year ago.
VFD Group Plc
VFD Group delivered a standout performance, with profit after tax more than doubling to N10.06 billion — a 100.8% increase. Gross earnings rose 30.5% to N53.71 billion, while Profit Before Tax climbed 98.4%. Investment and similar income increased by 30.2% to N49.13 billion, accounting for 91.5% of gross earnings. The company declared an interim dividend of 24 kobo per share. VFD’s standalone performance was even stronger, with gross earnings rising 62.5% to N23.87 billion and PBT surging 295% to N5.95 billion.
5. How Sustainable Is the Rally in First HoldCo?
Evaluating the sustainability of the current rally in First HoldCo Plc requires balancing the stock’s impressive structural momentum against its short-term fundamental valuation metrics.
Sustainability of the Rally
The recent momentum—which propelled the stock to ₦129.55 per share, marking a Year-To-Date gain exceeding 170%—is supported by real structural improvements, though short-term technical resistance is accumulating.
Key Structural Drivers (Supporting Medium-to-Long-Term Sustainability):
- Earnings Breakthrough: First HoldCo reported a record ₦653.5 billion pre-tax profit for H1 2026, with Profit After Tax surging 81.6% to ₦526.1 billion. Gross earnings rose 16.7% to N1.93 trillion.
- Balance Sheet & Asset Quality Transformation: Impairment charges dropped 37.4% to N116.1 billion, while the group recovered approximately N91.9 billion from legacy non-performing loans. Total assets expanded to N30.65 trillion, with customer deposits growing to N21.93 trillion.
- Recapitalisation Progress: FirstBank’s Capital Adequacy Ratio (CAR) rebounded to 16.7%, significantly de-risking the group relative to the CBN’s mandatory banking recapitalisation deadlines. Shareholders’ equity grew to N3.62 trillion.
- Non-Funded Income Resilience: Non-interest income soared to N497.1 billion, driven by electronic banking services, trade finance, and proprietary investment gains.
Key Risks to Sustainability (Short-Term Friction):
- Overbought Technical Indicators: Rallies exceeding 100% in a single month frequently encounter sharp profit-taking waves from institutional traders locking in gains.
- Contrasting Dividend Yield: At ₦129.55, the stock’s current dividend yield sits under 1.0%. High-net-worth liquidity could periodically rotate toward higher-yielding Tier-1 peers.
Is First HoldCo a Good Buy at Current Prices?
Evaluating a position at the current level depends heavily on the investor’s investment horizon and strategy:
- For New Allocations: Avoid deploying full capital in a single tranche at ₦129.55. Consider a Dollar-Cost Averaging (DCA) approach—scaling in slowly or waiting for a pull-back/consolidation phase toward intermediate support levels.
- For Existing Holders: Hold. The operational turnaround, improved asset quality, and robust balance sheet expansion provide little reason to fully liquidate a core long-term investment.
6. Why Is ABC Transport Trending Down?
The primary driver behind the recent downtrend in Associated Bus Company Plc, which led the losers’ chart with an 18.44% weekly drop, is a classic mix of profit-taking following an overextended rally and elevated market valuation metrics.
1. Aggressive Profit-Taking Post-Overbought Levels
Prior to the pullback, ABCTRANS experienced strong speculative buying, pushing its price up toward its 52-week high of ₦9.97. Having surged substantially year-to-date, technical indicators crossed deep into overbought territory.
2. Premium Valuation Relative to Sector Peers
ABCTRANS has been trading at a significant valuation premium:
- Price-to-Book (P/B) Ratio: Near 8.3x to 5.9x P/B, drastically higher than the broader industrial sector average (~1.4x)
- Price-to-Earnings (P/E) Ratio: Sits around 14.7x–17.5x, leaving little margin of safety
3. Broad Sector Rotation
With Q2/H1 earnings season underway, liquidity on the NGX has actively rotated out of high-flying mid-cap/services tickers into high-yielding Tier-1 banks and energy majors offering interim dividends.
The current decline represents a valuation reset and technical correction rather than a breakdown in core operations.
7. How Attractive Is Honeywell at ₦18.25?
At ₦18.25 per share, Honeywell Flour Mills Plc presents a moderately attractive valuation for long-term investors seeking turnaround value.
What Makes Honeywell Attractive
- Earnings Recovery & Finance Cost Reduction: PAT grew 13.01% year-on-year despite revenue pressures. De-leveraging reduced annual finance costs by 28% to ₦3.90 billion.
- Low Relative Earnings Multiple: A trailing P/E of 8.8x makes Honeywell one of the cheaper consumer staples counters on the NGX.
- Balance Sheet Optimisation: Cash balances nearly doubled to ₦9.81 billion, while current borrowings fell to ₦5.46 billion, boosting liquidity resilience.
Key Headwinds & Risks
- Pasta Segment Contraction: Revenue from pasta dropped significantly to ₦35.65 billion (from ₦89.31 billion in FY 2025).
- Selling & Distribution Inflation: Distribution costs jumped over 140% to ₦11.38 billion due to fuel price inflation.
- Low Dividend Yield: A 20 kobo payout yields only ~1.10%, offering minimal protection against high double-digit inflation.
Investment Verdict
- Short-Term Traders: Neutral. The stock faces technical resistance following recent single-day surges.
- Medium-to-Long Term Investors: Selective Buy on Dips. At ₦18.25, the stock trades at an attractive earnings multiple (~8.8x).
8. Stocks to Watch
As the NGX enters August, market focus is shifting toward companies with imminent audited H1 interim dividends, strong earnings turnarounds, and attractive valuation discounts.
Tier-1 Banking & Dividend Catalysts
| Stock | Catalyst |
|---|---|
| Zenith Bank | Trades around ₦126.50 (~5x P/E, 0.85x P/B). Board meeting scheduled to consider H1 results and interim dividend |
| Access Holdings | Priced at ~₦29.20 (~2.1x P/E, 0.4x P/B). Deep discount to underlying net asset value |
Energy & Industrial Heavyweights
Operational Turnarounds & Re-Rating Plays
9. Action Plan for Investors (Week of August 3–7, 2026)
Step 1: Focus on H1 earnings catalysts.
Prioritise Tier-1 banking counters (Zenith, Access) that have board meetings scheduled to approve H1 numbers and interim dividends.
Step 2: Rotate into quality.
With the Banking Index up 22.10% in July, some profit-taking is expected, but fundamentally sound banks remain accumulation targets.
Step 3: Monitor fixed-income competition.
With the MPR at 26.50%, keep equity allocations selective. Do not expect a V-shaped recovery.
Step 4: Watch for bargain hunting.
Following the 0.84% dip, fund managers are expected to pick up fundamentally strong blue-chip and mid-cap stocks that were overextended in late July.
Step 5: Stay selective and disciplined.
The market is shifting from broad speculative buying to disciplined, stock-specific positioning.
10. Final Summary & The Bottom Line
The NGX market review Q2 earnings reveals a market in transition. July 2026 was a remarkable month, with the ASI advancing 6.92% and the Banking Index surging 22.10%. However, the 0.84% weekly pullback reflects standard profit-taking and structural consolidation as investors digest H1 earnings releases and position for interim dividends.
text
  ┌──────────────────────────────────────────────────────────┐
  │      NGX MARKET REVIEW Q2 EARNINGS – KEY TAKEAWAYS       │
  ├─────────────────────┬────────────────────────────────────┤
  │ July 2026           │ ASI +6.92% | Banking +22.10%      │
  │ Performance         │ Market gained ₦11.11 trillion     │
  ├─────────────────────┼────────────────────────────────────┤
  │ Weekly Pullback     │ 0.84% decline | Turnover +32%     │
  │                     │ Active liquidity, not panic       │
  ├─────────────────────┼────────────────────────────────────┤
  │ H1 Earnings         │ NGX Group (+170% PBT) | First     │
  │ Standouts           │ HoldCo (+83.5% PBT) | VFD (+100.8%│
  │                     │ PAT)                              │
  ├─────────────────────┼────────────────────────────────────┤
  │ Sector Leaders      │ Banking (+22.10%) | Insurance     │
  │                     │ (+9.29%) | Industrial (+3.57%)    │
  ├─────────────────────┼────────────────────────────────────┤
  │ Stocks to Watch     │ Zenith Bank, Access Holdings,     │
  │                     │ Aradel, Dangote Cement, NGX Group │
  └─────────────────────┴────────────────────────────────────┘
The Bottom Line:
The NGX delivered exceptional returns in July 2026, with banking stocks leading the charge. However, the market is now entering a phase of consolidation and selective accumulation. The NGX market review Q2 earnings shows that companies delivering strong earnings and interim dividends are attracting institutional flows, while those facing margin pressures are experiencing sell-offs.
The most profitable approach this week is selective accumulation aligned with H1 earnings catalysts. Banking heavyweights (Zenith, Access) offer interim dividend potential. Energy and industrial leaders (Aradel, Dangote Cement) provide growth visibility. NGX Group offers exposure to the exchange operator’s exceptional performance.
For more weekly NGX updates and strategy guides, explore our market trends and analysis archive.
Disclaimer: This article is for informational purposes only and does not constitute investment advice. Always conduct your own research or consult a qualified financial advisor before investing. Past performance does not guarantee future results.